
For this example, we will produce geospatial data and analysis to answer the question of how and where to best extend financial services to "unbanked" individuals who do not really use financial services from banks, thrifts, and credit unions. Our objective is to provide a hopefully entertaining example of how to extend the first tier financial system to a community of currently unbanked individuals.
The attributes we will use for this example include Checking penetration data from RPM MarketBank for the blockgroups in Los Angeles County, California -- uploaded from a desktop environment. But you can do the same with any data and any regional geography that you wish to develop this analysis for, and the data can reside anywhere on your network, on the Web, or on ArcGIS Online.
Preparing the Data

Then, we right-click and Send the selected files to a Compressed (zipped) folder. We use 7-ZIP software to do this, which you can download from the official site.
Uploading the Data

 Log on to ArcGIS Online.
Go to My Content, select or create a Folder to store this analysis (here, RPM Consulting, LLC), and click Add Item.
 In Add Item, from On my computer, Browse for the compressed ZIP file created with 7 Zip.
Select Shapefile as the Contents, and since we are uploading more than 1,000 features, we will have Esri securely host this for us as a Feature Service. Give the item a Title, and Tags so it can be found in searches, and Add the Item.
ArcGIS Online will turn L.A. MarketBank into a hosted Feature Service.
Portraying and Analyzing the Map

Now, we can easily open it into any of a series of great basemaps that Esri provides free to subscribers.
Click Open, and Add to New Map.
We can also share the map with editing control, so our colleagues can not only view it and query it, but can collaborate.
Here is the new map. You will probably find that you will need to zoom in with the + sign a bit until the layer completely draws, because so many detailed features are involved (Census block groups or sub-neighborhood geography).


We can now do many things to portray this map.
We can set the Transparency, so that the basemap shows through better.
We can change Basemaps (from the Top menu), including Imagery.
We can Configure the Pop Up, what will be visible when you click on a feature to get its attributes.
We can Change Symbols to make a thematic map, and add infographics to it.
But for now, we are going to Perform Analysis. In later posts, we'll discuss Summarize Data, Find Locations, Data Enrichment, Proximity Analysis and Data Management.

But for this analysis, we'll choose Analyze Patterns, and Find Hot Spots.

Our Analysis field will be Checking Penetration.
The Layer name for the analysis will be Hot Spots Checking Penetration.
We're Saving the result in the RPM Consulting, LLC folder.
And, we're choosing to Use the current map extent that we zoomed into earlier.
.
Then, click Run Analysis.
And here is the map, with the Streets basemap.

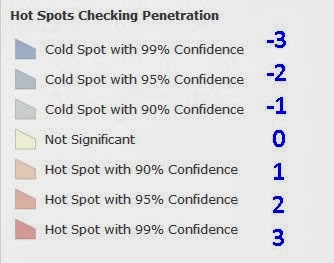
Here is how to interpret the hotspots.
There are 7 "Bins", ranging from the very cold (-3) to the very hot (3). Each feature is assigned to one of these bins. Cold areas have relatively low Checking penetration, and hot areas relatively high usage of Checking from a bank. The Confidence Levels refer to how sure we are that a spot is hot or cold. Typically, we are looking for differences at a minimum of a 90% level of confidence (a 90% chance that the observed value is hot or cold).

And, when you click on the feature, you will also get a Z score, called GiZScore, that tells you the Intensity - how hot is hot, and how cold is cold. Really cold or hot areas areas may have Z scores in the double digits, and these are called Outliers.
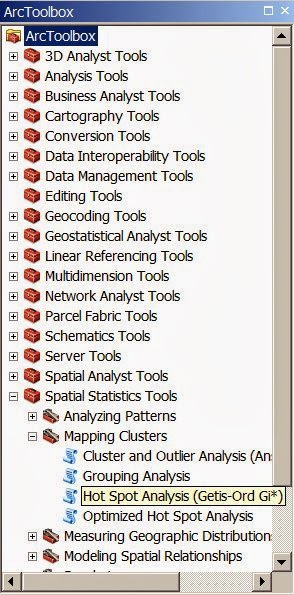
Hot Spots on ArcGIS Desktop
A Sidebar: Power users can bring this to the desktop GIS, integrate it, and analyze it with ArcGIS Toolbox. In fact, this complete tool in Toolbox provides parameters and output for Getis Ord Gi that are more robust and worth learning later.

Any questions? You know where to find us. And now, for our particular application, which you have just seen us prepare the data for.
Computer... Please Reach the Unbanked
 | |
| Chief Engineer |
So, We Gave It MarketBank Checking Demand data - the market penetration of the Checking service by Census Block Group for L.A. And the Chief Engineer said, "Computer... Please Reach the Unbanked."
And, It Gave Us this really cool Demand Surface for Checking (with BranchInfo branch locations and performance), based on the easiest, most accessible Getis-Ord-Gi analysis ever.


But then, you may find yourself in need of an upgrade - rather, an update, and a Communications Officer.

 |
| Communications Officer |
Users of other online mapping products, like PolicyMap? Great product, but Sorry to have to tell you this, you have a database mapper, not a GIS.
Anyway, here's where we took this, step-by-step, what we did with the result, and why. And then, you can do it too. But first, a little story.

And the first question I asked Neal was, if you had to tell me one thing about where we're going, what would it be?
Neal opened his briefcase, and it was filled with Berlitz "Learn Spanish" tapes. "It's going to be very important for banks to reach people who speak Spanish at home."
Hotspotting Hotspots
Now, let's fast forward to 2014. The Latino population has grown just as Neal said it would, and here in Los Angeles, we are clearly about to become a majority Latino city. The Census Bureau reports that for 2012, L.A. County is over 48% Latino. ESRI 2013 estimates report nearly 49%, reaching 50% by 2018 which is probably a conservative estimate considering undocumented and/or uncounted persons.
Yet, RPM's MarketBank shows that there are large proportions of the Latino community who remain unbanked - without basic Checking accounts - and are fodder for check cashers, predatory payday lenders, and worse.
 |
| October 2013 Mobile Study, Frank N.Magid Associates |
Here's where it gets VERY interesting for ANY bank. Latinos are more likely than average to own and use the payment system of the future - the smartphone. And among newly landed and recent immigrants, usage of smartphones easily exceeds usage of a Checking account. A recent Magid Study (infographic above) found that an amazing 87% of Latino respondents owned a smartphone, and in many neighborhoods the penetration of smartphones now exceeds that of Checking accounts.
Many Latinos who are unbanked are also Low or Moderate Income, or live in Distressed areas - where costs are absolutely prohibitive and it is difficult to place a full service branch, a storefront, or even a capable ATM. It is the McDonalds v. Subway analogy. Subway has a small footprint, generally one person in the front and one in the back, without a lot of specialized equipment. A McDonalds, like a bank branch, is far more expensive, more equipment, more furnishings, more maintenance, and more people. So, how can a Bank act more like Subway, and be able to place branches in marginal areas?

LOCATION ANALYTICS. Or, for those of you who need to quickly explain this to your grandma (or your CEO) on the elevator ride, BUSINESS GEOGRAPHY.
It is in these formerly marginal neighborhoods where RPM suggests providing access to the first tier financial system to unbanked individuals primarily, or even exclusively through their smartphones. And, to facilitate this, place free wi-fi for the community in existing branch, and also retail and public locations. As with hotel or city wi-fi, the customer accesses the Web via the bank's Host Page.
What do you think will happen to Payday and Predatory lenders, when the people they prey upon start depositing checks in banks on their smartphones (and start to direct deposit), to accounts whose cost of delivery becomes infinitesimal, and start getting their cash with a debit card at an ATM or POS?
Here is the hotspot map with RPM BranchInfo branch locations plotted on it. It clearly shows us the cold areas where there are also relatively few bank branches - prime underbanked communities.

It's East L.A. and the Bell area, the latter of which experienced some amazing levels of embezzlement by its recently convicted officials. So this is no surprise.

Next, we took a look at Latino population concentration in this area - visually, right off the map - and selected two areas where bank-sponsored public wi-fi is now under consideration.
As Flounder said best - "Boy is this great!".
So, the Blog is Back, by popular demand. We'll be seeing you at the User Conference. And we look forward to what should be a very interesting year, bolstered by the amazing new GIS environment and spatial toolset known as ArcGIS Online.
Elio Spinello of RPM disavows all 1960s and 1970s references in this article.