Tuesday, December 28, 2010

Customer Service Stars


I have been elbow deep in dust in a data center with a dropped dongle – you overnighted it.

I’ve sucked on a bad BA thumb drive – you replaced it. 

Frozen out three disks in on a four disk install five times in a row – you replaced them.

Clients due were denied support – you got it for them.

My install codes gone, my licenses corrupted – you got me new ones, in minutes.

This may be news to a lot of people, but no one – No One – we work with in our practice makes us feel more valued, does more to help us, and to help our customers, than ESRI Customer Service, and our old friends in the ESRI Partners program.  All problems resolved, fast - in a calm and considered voice, by someone who understands when things are not going so well and makes them better.  Someone who knows that business systems are not always customer-centered and makes them work.

Here in California, our rep has been Rick Witham, our forever Partner Goddess is Nancy Forrest, and Dave Wieseler still looks out for us even though it’s not even his job anymore.  Rick is moving on now to Event Management where he will have even a greater impact – well done.

At this Holiday time of the year, we’d like to take a moment to recognize the extraordinary people who help us help you.  And we’d like to encourage everyone to get to know the Customer Service Angels who serve them. 


Thursday, December 9, 2010

Important Changes to Your Checking Account - Checking Fees & Branch Attractiveness

Free checking is dead.  We've all heard the news.  It's the same all over.  Or is it?

We think the death of "free checking" is the greatest marketing opportunity since the invention of the giveaway toaster. 

Those who are truly retail oriented will do well, and traditional banks will not.  Why not?  Because most big commercial banks don't understand the retail impact of charging significant fees, every month, for something that was once provided free - and how such a move can make branches less attractive than nearby and online options and cause defections of solid relationships, not just cherry pickers (single service, low balance free checking customers).

Presented for your inspection, one Chase Bank.  We think that Chase has perhaps considered, but not calculated, the valuable business it will lose to nearby branch competitors by going from $0 to $120 annually for a Checking account.  In other words, it doesn't seem like they did any focus groups to find out that we all go ouch at 10 bucks; nor have they conducted a gravity analysis that includes the institution of the new fees as an attractiveness variable, along with all other things geo and geodemographic, to see what might happen competitively, branch trade area by branch trade area, as everyone changes their prices at the same time. 

Chase is a commercial banking culture and they are relying largely on inertia here, the inherent difficulty in changing Checking account providers.  There is an old rule in retail banking that whenever one raises fees, one provides at least 5 different ways for customers to avoid those fees.  Chase has provided four, and they have holes in them.

Direct deposit $500 or more each month, which is fine if your employer supports that, but it doesn't really work for small business or many other people.

Or, keep a minimum DAILY balance of $1,500, which means you will trigger the fee if your Checking balance goes below $1,500 at any time, which means you have tied up $1,500 in a zero-interest account and lose any investment opportunity associated with it. 

Or, maintain an average monthly balance of $5,000 or more at Chase, deposit-driven and not very young household or family-friendly.

Or, already be paying $25 or more to Chase in monthly fees.

Those are the commissions, among glaring omissions are not waiving the fee for customers with an auto loan who autopay, nor creating any other ways for transaction and credit driven households to avoid the fees.

At RPM, we are currently using GIS to predict what the outcome of "the death of free checking" will be at the branch level, associating all of the fee changes for each competitor for every branch in our national BranchInfo branch performance and locations database, and using the new fees as an input to calculating store attractiveness in branch trade areas.

And what we are beginning to see is the potential for a major shift towards the first big bank retailer(s) that act(s) like one in 2011, as many people figure out how to make smarter banking choices along the routes they travel every day.  And increasingly, location-based marketing will push messages to the fee averse based on their location when they come within range of a significant differential, where one competitor may be ranked significantly better or worse on the basis of fees and ultimately, value.  (To keep up with location based tecnology trends, be sure to visit the RPM blog.)

Chase is just one example, and has hired some great retail banking people, but do they have the research, the tools and the technology to deal with this?  Do you?

Tuesday, November 30, 2010

Business Analyst 10 Service Pack Download

Esri Business Analyst 10 Service Pack 1 (SP1) is now available from the Esri Support Center. This service pack contains several performance improvements and maintenance fixes. 

Here are some of the issues it is meant to fix that we have heard of... there is an exhaustive list on the Download page.


NIM061242 - BA 10 Bug:  Changing the terms "Customer" and/ or "Store" in Preferences does not persist in the wizard's text, i.e. they are still called "Customers" and "Stores" after about the third window during cust/store setup.

NIM061418 - BA 10 Bug: Entering text into the SIC search box, when using Add Business Listings (Classic view), does not work. Work around is to type in caps.

NIM061777 - The word County is duplicated in the label for the County Labels layer .  Workaround outlined in kb38382.

NIM061817 -  Spatial Query Layers used to create Customer and Store layers crash Business Anlayst 10 (contains workaround).

NIM061901 - When data apportionment is set to Hybrid reports and spatial overlay will return zeroes for rings 10 miles and larger [changing to block apportionment is the workaround].

NIM061902 - BA 10 Bug: After creating/adding a custom bds layer, using the geocoder results in an error: "Geocoding Service is damaged, do you want to repair it?" Restarting BA and not adding the custom bds will resolve the issue.

NIM061969  - BA 10 Bug: Customer Setup to geocode addresses results in Unhandled Exception, referencing out of memory.

NIM061972 - BA 10 Bug: USA Geocoding Service is not Geocoding records it successfully geocoded at 9.3.1.

Let's see if these all got in there, as well as the long list on the Download site, and if you don't see your issue here or there, let us know!

Esri recommends that customers using Business Analyst 10 and Business Analyst Premium 10 download and install this service pack at their earliest convenience.  You don't need the core ArcGIS 10 SP1, bit it is also now available from the Esri Support Center, and it should not break anything BA and offers some core improvements and fixes that may be helpful.

Wednesday, November 17, 2010

Centralized Layer Management

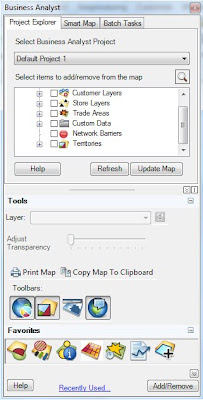
One of many cool things in Business Analyst 10 is the Project Explorer tab of the Business Analyst Window.  For the first time, ArcGIS users can manage layers centrally, instead of having to open them one at a time.  This is especially tedious when making changes.

Now, in one powerful window or dialog, we can choose which Project to work with; which layers are on and off in the project, and the transparency of each layer. There are also helpful project level controls allowing you to print the map, copy it to the clipboard, add or remove toolbars.

Most powerfully, one can perform analysis on the layer by choosing a tool/wizard from the Favorites bar.  The defaults include Spatial Overlay, Dynamic Rings, Drive Time, Grid, and Custom Data Setup to prepare one of your own layers for analysis.


Where are we going with this?  Back to the future.

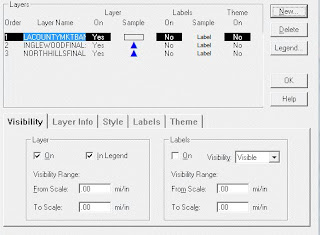
Here is the Layers and Themes control in Atlas GIS 4.0, which to date has been the only ESRI product with centralized layer management.

In Atlas, one has control over most of the important settings for each layer in one convenient place, including visible range, theme, symbology (style), label settings, legend, and layer info (source tab).

Which is among the reasons why, 10 years after it was discontinued, we still get calls for help with Atlas GIS, and we still produce a low cost geocoder for those who can't bear to part with it.

Wednesday, November 10, 2010

Can Brand Perceptions Impact Store Attractiveness?

The answer is, perceptions of customer service and value of the overall brand may absolutely impact store attractiveness - in fact, GIS analysis suggests they can make all the difference.

Here's a little market in Minnesota, but it could be your neighborhood.  There are four banking competitors and six branches here in the space of about 1/2 a mile - US Bank with two branches to the north, TCF Bank with two to the southeast, and Wells Fargo and M&I with one branch each towards the west.  Using customer perceptions of Overall Satisfaction, Reasonable Fees and Easy to Resolve Problems from the most recent JD Power Retail Banking Study for this region, we assigned the JD Power scores for each bank to each of its branches.  Then, we ran a very basic Huff model based on these perceptions, at left. 

The analysis shows that M&I will be able to successfully compete in this market with a much smaller office, and just one office, because the perceived service quality and value are attractive enough to have influence throughout the entire southern portion of the area.  To the north, US Bank benefits from having two offices with better perceptions than either Wells or TCF, and dominates the entire northern area. 

Based on deposits, which with date opened and several other factors is usually considered a key factor of attractiveness, we would expect something entirely different, depicted to the right in a model based purely on deposit size.  M&I is overwhelmed in this analysis, by the large Wells branch, the two TCFs including one large office, and the two US Bank locations.

Looking at the same neighborhood by equal competition or Thiessen analysis, where equidistant lines are drawn between each branch and its adjacent branches, this tends to flatter the institutions with multiple branches (left).


Simple rings tend to flatter the multibranch US Bank and TCF even more, as they dominate the market to the north and south, respectively.


Meanwhile, drivetime polygons tend to depict a lot of overlap, given the immediate proximity of all the offices to a single, main intersection.


Hardly definitive, but food for thought.  To what extent can perceptions of good customer service and value overcome weaker convenience and ease of access, and how do we model it in GIS?  By the way, that is RPM's MarketBank potential for deposits as the underlying theme, the greener the better.

Monday, November 1, 2010

Blind To Site, Part III


Back in the day... Site work used to be so much... work.

Trudging around, filling out a site questionnaire longhand that would only need to be transferred to a computer later. Then, brought step by step into a spreadsheet, a database.

Then finally into desktop GIS, ultimately to be integrated with the existing network.

Fumbling for a camera to take photos. Mumbling voice notes into a hand-held voice recorder.  Scrambling on the cellphone to relay resultsWorst of all, dropping the notebook PC you brought out with you, ostensibly to save a little time.

No more.  Now we do it all on the Samsung Ultra Mobile PC.  On one tablet device, I can do it all - photos, voice, full Excel spreadsheet, even ArcGIS.

Suddenly, what used to take forever and was no fun at all is now made quick, easy, fast.  Work has become a pleasure again.  I can collect all the rich data I need in every way I need literally in the palm of my hand.

And integrate my field work with the network in real time.

Not to mention that tablet computing is a blast, and definitely the next Big Thing (witness the IPad).  
However - unlike the IPad, this Samsung has an integrated QWERTY keyboard - and more importantly, a full blown OS (Windows XP SP3), a powerful mobile CPU, and fully 2GB of RAM.  And if you are not quite as literate texting as your kids are, you can write longhand right onto the PC using a stylus and an input area, and the handwriting recognition kicks in.

What a joy it is to gather the info digitally, once,
into an Excel spreadsheet...
then pull that into ArcGIS...
integrate it with the existing network...
analyze the impact on that network...
compare it with other site options... and
distribute the information throughout the organization and to partners before I even get back into the car to drive to the next site.


We've been using these Samsung UMPCs for over three years now, and we love them.  More so, we're in love with tablet computing.  

So much so, we just bought one of Samsung's new 40 inch touchscreens.

Now, I just have to find a way to mount it into my vehicle.

Thursday, October 28, 2010

1stBank Deploys QR Code Advertising

It's a link.  It's a bar code.  It's Pop Art.  It's a QR code!  And it's another mobile technology that caught fire in Japan years ago and is still finding its way to the States.

On the one hand, this is a very promising mobile technology, on the other, just another way to pass a link.  Content is king, as always.  If the website or other content you are whisked off to is useful, valuable, and/or entertaining, then you have something.  If your site is lame, and/or you are lame in referring customers to it and then dropping the ball, you will remain lame (just a more geeky lame).

1stBank in Colorado is one of the first movers on QR codes, providing reading material and puzzles for a virtual waiting room in the Denver International Airport.  QR code posters inside the airport (photos courtesy of The Financial Brand) are headlined “Free Books,” “Free Crosswords,” and “Free Sudoku” and link to a selection of classic novels, crosswords and Sudoku.

Microsoft has its own, color version of QR codes, aimed particularly at mobile tagging applications, called Microsoft Tag.

You can create QR codes to your own content at sites like this- the technology is free of any license, easy to use, and offers some very interesting opportunities.

Here's a QR code to RPM's The GIS Biz, which covers general business and location intelligence news.

Monday, October 25, 2010

Savings and Investment Potential by Political Party Preference: An Analysis of Political Contributors

Occasionally, as we dig through the various databases we use in our practice, we discover datasets that have to potential to answer interesting questions that we sometimes wonder about. This past summer, we happened across the database of political contributions by zip code through July 28, 2010, made available at CampaignMoney.com, which provides access to all political contributions recorded by the Federal Elections Commission.  We thought it would be interesting to see whether zip codes differ with respect to socioeconomic status as measured by savings and investment potential, based upon which party received the majority of contributions. 
Our methodology was rather straight-forward. We began by categorizing each zip code in California, based on whether the largest percentage of contributions was made to Democrats, Republicans, or “Other. We then calculated the average MarketBankTM deposit potential and investment potential per resident household and then tested the means for statistical significance using an Analysis of Variance (ANOVA) procedure.  As a second method of evaluating differences, we also categorized zip codes in which all of the contributions went entirely to a single party (or other), versus those in which contributions were spread between two or more parties.
Findings
Overall, CampaignMoney.com provided data for 26,791 zip codes in which political contributions were made, of which 21,683 were able to be matched to the MarketBankTM database.  Within the zip codes matched to MarketBankTM, a total of $916,895,087 was contributed, broken out as follows:

Party
Total Contributions
Zip Codes Contributing Predominantly to One Party
Zip Codes Who Contributed Entirely to One Party
Republicans
$139,787,007
2,307
809
Democrats
$369,233,991
3,674
1,227
Other
$407,874,089
7,791
3,405
No contributions
7,911
16,242


MarketBankTM deposit potential estimates were calculated for each zip code on a “per household” basis, providing the average bank checking and savings deposits likely to be held in U.S. financial institutions. Based on the classifications of zip codes by contributions by political party, the average deposit potential and investment potential per household for zip codes were averaged for zip codes who predominantly contributed to Republicans, Democrats, and others (as well as those from which no contributions were recorded to any party.
The key question we wanted to answer was whether there is a significant difference between contributors to Democrats and contributors to Republicans on the basis of the socioeconomic status of the contributor’s zip code. Using the MarketBankTM bank deposit potential per household and investment potential per household as two proxies for socioeconomic status, we discovered that there is a statistically significant difference (p<.001) between zip codes in which residents primarily contribute to Republicans versus those who primarily contribute to Democrats.  The average deposit potential per households of predominantly Republican-contributing zip codes was $19,021, compared to $20,465 for Democrat-contributing zip codes, and $19,763 for zip codes that contributed predominantly to other parties.
Investment potential per household followed a similar pattern, with Republican zip codes being lowest and Democrat zip codes highest in terms of potential.

Party
Zip Codes Contributing Predominantly to One Party
Bank Savings Deposit Potential per Household
Investment Potential per Household
Republicans
2,307
$19,021
$227,451
Democrats
3,674
$20,465
$257,226
Other
7,791
$19,762
$242,168
No contributions
7,911
$17,552
$199,998


With respect to zip codes in which all contributions were made entirely to a single party, a similar statistically significant pattern (p<.001) can be observed , with the average deposit potential of $18,003 for Republican zip codes falling somewhat lower than the $18,542 for Democrat zip codes, and $18,621 for zip codes where all of the contributions were intended for a party other than Democrat or Republican.

Party
Zip Codes Contributing Entirely to One Party
Bank Deposit Potential per Household
Investment Potential per Household
Republicans
809
$18,003
$208,191
Democrats
1,227
$18,542
$220,746
Other
3,405
$18,621
$218,923
No contributions
16,242
$19,958
$261,128


Although, the difference is not overwhelming, one can conclude from these data that communities (as defined by zip codes) in which political contributors lean Republican may tend toward less wealth in comparison to communities in which contributors lean Democrat, or toward other political parties. Although this does not represent an exhaustive study of socioeconomic status associated with party preference, it provides an interesting starting point for further analysis.  In particular, a further breakdown of the “other” contributors may provide some insight as to where those funds are ultimately directed, and how those contributors may differ demographically.