Thursday, March 20, 2014

Payday


Most bankers know Payday loans as very short term unsecured loans sometimes timed to match up with the borrower's paycheck issuance. However, many banking professionals do not think of payday lending as a potential source of fee income for financial institutions.

When done right, with the right channel, at low cost - as at Walmart - payday lending can add a contribution to profitability and customer value.


But when it is done wrong by payday lenders, it is not very sweet.

Although in the hands of some lenders payday lending can be predatory and test the limits of usury, when implemented ethically it can also present retail community banks with an important new opportunity.

While charge-offs and losses have been reported as high as 20% on these loans, and the small loan amounts incur the same processing costs as far larger loans, there is still a gap between what payday lenders charge and what a Walmart charges that is large enough for a community bank to drive a Brinks truck through.  Does a $15 charge on a $100 14-day payday loan seem reasonable?  That represents an Annual Percentage Rate of nearly 400%, and drains low income communities.  In California, the legal APR is even higher, an amazing 459%.  (For the statutes in your state or states, check the National Conference of State Legislatures). 

Payday lending is legal and regulated in 37 states, but it is important to note that under the Dodd–Frank Act, the Consumer Financial Protection Bureau now has specific authority to regulate all payday lenders, regardless of size.  Count on Fair Lending Risk attributable to payday lending to rise significantly this year.

According to a study by the Pew Charitable Trusts, most payday loan borrowers are white, female, and are 25 to 44 years old. However, after controlling for other characteristics, Pew reports five groups that have higher odds of having used a payday loan: 
  • Those without a four-year college degree.
  • Home renters.
  • African Americans.
  • Those earning below $40,000 annually.
  • Those who are separated or divorced.
In another study by the Division of Research of the Federal Reserve System and the Financial Services Research Program at the George Washington University School of Business, 18% of payday borrowers had an income below $25,000, 41% earned between $25,000 and $50,000, and 39% reported incomes of $50,000 or more.

But most definitively, the Federal Reserve Board uses the Survey of Consumer Finances to define who is using payday lending services.  The FRB began collecting data on who uses payday loans in 2007, and examined it in the FRB Bulletin in 2009.

We now have several sets of data to evaluate.  As is the case with many financial services, age and income tell the basic tale.  The age of borrower is one primary determinant, with usage of payday loans clearly highest among those Under 35, while the usage by those 65+ is, essentially, zero.

Similarly, the lower-income cohorts dominate usage, while the top cohorts are absent.  Net worth is also a tell, to use the poker term, with the percentage of families with median or above net worth who use payday loans essentially zero as well.

RPM uses raw FRB data from the SCF to develop demand and potential surfaces for the U.S. (for a bit of alphabet soup) using an array of these and other select demographic and geodemographic variables.  The resulting Payday Lending Demand and Potential is included in the RPM MarketBank: Delivery Systems package (which also includes debit card and branch usage surfaces, among others).

Using ArcGIS Online to Determine Payday Lending Potential


Using the new Delivery module of RPM MarketBank, and ArcGIS Online, RPM has created an interactive demand surface for Payday Lending for the U.S. (above).  Here is how we did it, how we added branch locations, and applied this ArcGIS Online solution to show a sample client bank how to enter and serve an under-banked market and profitably undercut the payday lenders.

Creating the Map

For this example, we will assume that a banking client is interested in exploring a potentially under-banked neighborhood in Seattle called North Park.  The objective of this example is to better understand the potential demand for payday lending in North Park.

To explore this example, log on to your ArcGIS Online account, go to My Content, and click "Create Map".


This might not look like much to a lot of people, but I've been waiting for push-button mapping for a long, long time.

The client's question is about Seattle, WA - so we'll enter Seattle in the search bar, and navigate right to a Seattle base map of my choice, including imagery.  And again, quite frankly, what ArcGIS Online is able to do, as easily as it it does it, is not something that I ever anticipated.


The client is interested in an under-banked neighborhood in Seattle called North Park, and has a spreadsheet of branches already in the general area.  This spreadsheet is based on RPM BranchInfo 2014, which contains national competitor branch location data and over 10 years of history for approximately 95,000 bank branches.  But you could use any list of addresses saved as a comma-delimited file (.CSV) in Excel.


And, just drag the Excel address list from its folder in Windows...

drop it on the map,

tell ArcGIS Online which columns have the address information...


Once added, ArcGIS online will automatically draw the branches on a street map.  Didn't see this one coming, either.  The map symbols are a little hard to see, though.  And since we're using BranchInfo, we'll also take the opportunity to visualize them based upon their 5-year deposit growth histories.  

So, let's do that, by clicking on the down arrow for the North Park branches, and using Change Symbols to portray them by 5 year growth (GROWTH5YR).  This way, the fastest growing branches will appear the largest on the map.  The result is the map below, that shows that there are a number of branches surrounding, but not in, North Park.

A little street-pattern analysis of the resulting map (below) shows that the branches growing the fastest over the past 5 years are predominantly in one corridor.

This corridor connects the branch cluster in the lower left along Hofman Rd NW, becoming NW 105th St., which then becomes N. Northgate Way and finally NE Northgate Way on the other side of I-5, where the other cluster of branches is.
Now, we are ready to bring in the Payday Lending demand from MarketBank.  Since the client is interested in other Fair Lending aspects of branch placement for payday lending, we are using the RPM Lendfair dataset, which is already a hosted feature service on ArcGIS Online and contains the Payday data from MarketBank.

We simply use Add and Search for Layers to add Lendfair from My Organization (but soon, everyone will be able to access a basic version of RPM Lendfair).

Then, in a process similar to what we did with the branches above, we use Change Symbol on the Lendfair layer to select and map the Payday Lending Demand.

The numeric Payday scores are indexes, with a value of 100 being equal to the U.S. average.  The darkest red areas (scored 129-207 in the map legend) represent Census block groups from 29% to 107% more likely than average to have used a Payday loan in the last year.

We now know the general location that will be ideal for an entry into the North Park neighborhood.  It is in an area of high demand, in the key banking corridor, between the two clusters.  This is highlighted in the map above.

Now, we have a very good, quantitative idea of location.  Next, we will see where the payday lenders are, and bring ArcGIS Online with us when we hunt for sites -

Which we'll be covering in a near-future blog post.


Friday, January 31, 2014

Computer... Please Reach the Unbanked

Sophisticated, powerful spatial analysis tasks are made easy now with ArcGIS Online. In this article we will explore, on a step-by-step basis, an example of how ArcGIS Online can be used to solve a real-world problem in the financial services industry.


For this example, we will produce geospatial data and analysis to answer the question of how and where to best extend financial services to "unbanked" individuals who do not really use financial services from banks, thrifts, and credit unions. Our objective is to provide a hopefully entertaining example of how to extend the first tier financial system to a community of currently unbanked individuals.

Here, given a set of weighted features, we will use a data visualization technique based upon the thematic mapping of significant hot spots and cold spots, which are determined using the Getis-Ord Gi statistic. Once produced, the analysis can be shared with colleagues on a rich online map -- With no prior knowledge required.

The attributes we will use for this example include Checking penetration data from RPM MarketBank for the blockgroups in Los Angeles County, California -- uploaded from a desktop environment.  But you can do the same with any data and any regional geography that you wish to develop this analysis for, and the data can reside anywhere on your network, on the Web, or on ArcGIS Online.

Preparing the Data
From My Output Data in Windows Explorer, or wherever you store your files, we're going to select and highlight all the components comprising the shapefile.  Here, our MarketBank data for L.A. County.

Then, we right-click and Send the selected files to a Compressed (zipped) folder.  We use 7-ZIP software to do this, which you can download from the official site.

Uploading the Data

Log on to ArcGIS Online.


Go to My Content, select or create a Folder to store this analysis (here, RPM Consulting, LLC), and click Add Item.


 In Add Item, from On my computer, Browse for the compressed ZIP file created with 7 Zip.

Select Shapefile as the Contents, and since we are uploading more than 1,000 features, we will have Esri securely host this for us as a Feature Service. Give the item a Title, and Tags so it can be found in searches, and Add the Item.


ArcGIS Online will turn L.A. MarketBank into a hosted Feature Service.

Portraying and Analyzing the Map


Now, we can easily open it into any of a series of great basemaps that Esri provides free to subscribers.

Click Open, and Add to New Map.

We can also share the map with editing control, so our colleagues can not  only view it and query it, but can collaborate.

Here is the new map.  You will probably find that you will need to zoom in with the + sign a bit until the layer completely draws, because so many detailed features are involved (Census block groups or sub-neighborhood geography).


We can now do many things to portray this map.

We can set the Transparency, so that the basemap shows through better.

We can change Basemaps (from the Top menu), including Imagery.

We can Configure the Pop Up, what will be visible when you click on a feature to get its attributes.

We can Change Symbols to make a thematic map, and add infographics to it.

But for now, we are going to Perform Analysis.  In later posts, we'll discuss Summarize Data, Find Locations, Data Enrichment, Proximity Analysis and Data Management.


But for this analysis, we'll choose Analyze Patterns, and Find Hot Spots.


Our Analysis field will be Checking Penetration.

The Layer name for the analysis will be Hot Spots Checking Penetration.

We're Saving the result in the RPM Consulting, LLC folder.

And, we're choosing to Use the current map extent that we zoomed into earlier.
.
Then, click Run Analysis.


And here is the map, with the Streets basemap.

Interpreting the Hot Spot Analysis

Here is how to interpret the hotspots.

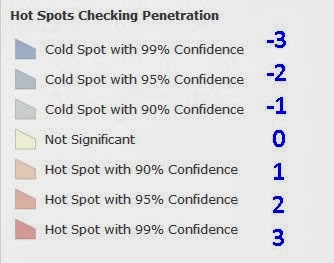
There are 7 "Bins", ranging from the very cold (-3) to the very hot (3).  Each feature is assigned to one of these bins.  Cold areas have relatively low Checking penetration, and hot areas relatively high usage of Checking from a bank.  The Confidence Levels refer to how sure we are that a spot is hot or cold.  Typically, we are looking for differences at a minimum of a 90% level of confidence (a 90% chance that the observed value is hot or cold).


And, when you click on the feature, you will also get a Z score, called GiZScore, that tells you the Intensity - how hot is hot, and how cold is cold.  Really cold or hot areas areas may have Z scores in the double digits, and these are called Outliers.


Hot Spots on ArcGIS Desktop

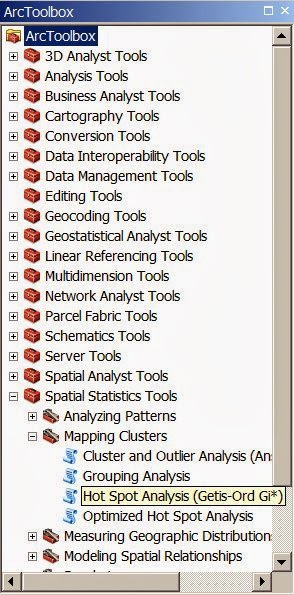
A Sidebar:  Power users can bring this to the desktop GIS, integrate it, and analyze it with ArcGIS Toolbox.  In fact, this complete tool in Toolbox provides parameters and output for Getis Ord Gi that are more robust and worth learning later.


Any questions?  You know where to find us.  And now, for our particular application, which you have just seen us prepare the data for.

Computer... Please Reach the Unbanked

Chief Engineer
We asked ArcGIS Online to show us where the unbanked people are in Los Angeles, which is the first step in trying to reach them.

So, We Gave It MarketBank Checking Demand data - the market penetration of the Checking service by Census Block Group for L.A.  And the Chief Engineer said, "Computer... Please Reach the Unbanked."

And, It Gave Us this really cool Demand Surface for Checking (with BranchInfo branch locations and performance), based on the easiest, most accessible Getis-Ord-Gi analysis ever. 


Even MapInfo and Nielsen users can do this, simply by preparing your MarketBank or Nielsen data on Checking for upload to ArcGIS Online through the... yes, Universal Translator in MapInfo.

But then, you may find yourself in need of an upgrade - rather, an update, and a Communications Officer.

Communications Officer


Users of other online mapping products, like PolicyMap?  Great product, but Sorry to have to tell you this, you have a database mapper, not a GIS.

Anyway, here's where we took this, step-by-step, what we did with the result, and why.  And then, you can do it too.  But first, a little story.

When I first joined First Interstate Bancorp in 1983 as a primary research analyst and product developer, the first person I met was Neal Skowbo.  Neal headed syndicated research for all of our affiliates and franchisees, and had formerly been the Director of Research for the Financial Institutions Marketing Association for many years.  He would later be the Research Director at gargantuan Western International Media. 

And the first question I asked Neal was, if you had to tell me one thing about where we're going, what would it be?

Neal opened his briefcase, and it was filled with Berlitz "Learn Spanish" tapes.  "It's going to be very important for banks to reach people who speak Spanish at home."

Hotspotting Hotspots

Now, let's fast forward to 2014.  The Latino population has grown just as Neal said it would, and here in Los Angeles, we are clearly about to become a majority Latino city.  The Census Bureau reports that for 2012, L.A. County is over 48% Latino. ESRI 2013 estimates report nearly 49%, reaching 50% by 2018 which is probably a conservative estimate considering undocumented and/or uncounted persons.

Yet, RPM's MarketBank shows that there are large proportions of the Latino community who remain unbanked - without basic Checking accounts - and are fodder for check cashers, predatory payday lenders, and worse.

October 2013 Mobile Study, Frank N.Magid Associates


Here's where it gets VERY interesting for ANY bank.  Latinos are more likely than average to own and use the payment system of the future - the smartphone.  And among newly landed and recent immigrants, usage of smartphones easily exceeds usage of a Checking account.  A recent Magid Study (infographic above) found that an amazing 87% of Latino respondents owned a smartphone, and in many neighborhoods the penetration of smartphones now exceeds that of Checking accounts.

Many Latinos who are unbanked are also Low or Moderate Income, or live in Distressed areas - where costs are absolutely prohibitive and it is difficult to place a full service branch, a storefront, or even a capable ATM.  It is the McDonalds v. Subway analogy.  Subway has a small footprint, generally one person in the front and one in the back, without a lot of specialized equipment.  A McDonalds, like a bank branch, is far more expensive, more equipment, more furnishings, more maintenance, and more people.  So, how can a Bank act more like Subway, and be able to place branches in marginal areas?

Well, maybe we don't even want to be Subway.  Maybe we want to extend the Papa John's idea, the Domino's idea - and make the phone, the branch.  So guess what you need?

LOCATION ANALYTICS.  Or, for those of you who need to quickly explain this to your grandma (or your CEO) on the elevator ride, BUSINESS GEOGRAPHY.

It is in these formerly marginal neighborhoods where RPM suggests providing access to the first tier financial system to unbanked individuals primarily, or even exclusively through their smartphones.  And, to facilitate this, place free wi-fi for the community in existing branch, and also retail and public locations.  As with hotel or city wi-fi, the customer accesses the Web via the bank's Host Page.

What do you think will happen to Payday and Predatory lenders, when the people they prey upon start depositing checks in banks on their smartphones (and start to direct deposit), to accounts whose cost of delivery becomes infinitesimal, and start getting their cash with a debit card at an ATM or POS?


Here is the hotspot map with RPM BranchInfo branch locations plotted on it.  It clearly shows us the cold areas where there are also relatively few bank branches - prime underbanked communities.


It's East L.A. and the Bell area, the latter of which experienced some amazing levels of embezzlement by its recently convicted officials.  So this is no surprise.


Next, we took a look at Latino population concentration in this area - visually, right off the map - and selected two areas where bank-sponsored public wi-fi is now under consideration.

As Flounder said best - "Boy is this great!".

So, the Blog is Back, by popular demand.  We'll be seeing you at the User Conference.  And we look forward to what should be a very interesting year, bolstered by the amazing new GIS environment and spatial toolset known as ArcGIS Online.

Elio Spinello of RPM disavows all 1960s and 1970s references in this article.


Wednesday, March 21, 2012

Riding On The Metro

The Consumer Preview of Windows 8 has been out for a few weeks now, and you really should download it yourself and check it out.  Don't let it overwrite your Windows 7 or earlier, though, because you will end up having to buy Windows 8 whether you like it or not.

But.  The bottom line remains, this is a touchscreen and tablet release with the desktop bolted underneath, and while novices and Apple users and mobile users and those who love clean design will love it, business and Windows users probably won't.  Because while it does let you get at things you really need more quickly via Metro tiles, it does not offer much to the traditional desktop user, and the removal of the Start button is going to throw some people for a loop - and there is no way to hack it back, as there was with the Developer Preview.  And since it works differently whether you are using touch (it's all about edge gestures) or mouse (it's all about corners), this might prove confusing to some folks, almost like using a schized-out OS.

On the plus side, those who saw the Developer Preview from last September's BUILD conference will find the horrible green background gone, and apps here that are much more polished and closer to prime time (if such a metaphor even holds any more, especially for this audience!)  and, for those of us who love keyboard shortcuts, those are there - Ed Bott points out a few of the most useful, of which I find these most key (pun).

Windows key + comma Peek at the Windows desktop
Windows key + Q Search Apps
Windows key + F Search Files

Should you be riding on the Metro?  Or are you a smitten desktop lover feeling caught on a track that goes only one way?


More soon on how ArcView, Business Analyst and other ESRI apps install and perform on W8.


Tuesday, November 29, 2011

Mapping The Vast Indoors

A few years ago, my old friend Brad McCallum (who is now at APOS integrating BI and GIS) and I were doing a trade show for ESRI when Brad had a thought.  All of this trade show should be in a GIS, not just in a paper map.  And you should be able to use it to find what you want and navigate the show.

To which I said, all space can be mapped, including indoor spaces - and not just malls and airports and bus and train terminals, but casinos and libraries and you name it.  Including the space between your ears.  This is where GIS and CAD show their common parentage. 

Another good friend and colleague and GIS developer extraordinaire Kurt Gunther did just this - with hospital beds, in his great eBeds software that manages hospital beds, and the folks in them and serving them, just like they were GIS features.


Today, Google made it real for the average person.  "Google Maps 6.0 for Android brings the freestanding map directory to the palm of your hands," announced today on the Google blogs. These detailed floor plans automatically appear when you’re viewing a map and zoom in on a building where indoor map data is available.

For now, the data is limited - Ikea, a few Macy's, the Mall of America, a few major airports.  But we all know where we're going.  Where Brad said we would, more than ten years ago.  And the possibilities, for those of us in GIS land in general, and in ESRI and APOS land in particular, are infinite.

Tuesday, November 1, 2011

Bank of America Backs Down On $5 Monthly Debit Card Fee

Graphic: Joe Lackow
As it turns out, it was a short wait before Bank of America decided to cancel the $5 monthly debit card fee, wherein the customer is explicitly charged for accessing their own money with a card instead of a paper check.  Wasn't the whole idea to use the cheaper, greener card payment?  Nuh uh.  I guess.

Anyway, the bank announced today that they are backing down.    And the statement came directly from the COO, who is probably livid with his PR people right about now.  The official statement, from David Darnell, the Bank's Co-COO, which is probably just how Dave feels today.

"In response to customer concerns and the changing competitive marketplace, Bank of America no longer intends to implement a debit usage fee.  We have listened to our customers very closely over the last few weeks and recognize their concern with our proposed debit usage fee,  Our customers’ voices are most important to us. As a result, we are not currently charging the fee and will not be moving forward with any additional plans to do so."

In other words, we invited regulatory, governmental and public scrutiny, we misinterpreted our original customer research, we were cynical about the stickiness of electronic banking and its weight on customer inertia, we failed to gauge the social climate about as badly as we misjudged the competitive climate - and our major competitors became so upset that we upset consumers so much, they cut and ran and left us twisting in the wind, alone.


I know that Pete Hart, who I worked for at First Interstate and who later became President of MasterCard and Cirrus and knows as much about how people like to use payment cards as anyone ever has, is bemused right now.  The industry got a black eye, and the COO had to step in, because they just don't have solid marketing people and strategic planners like Pete Hart and Dick Rosenberg at the helms of these big banks anymore.


Leading a balanced life with Richard M. Rosenberg, former CEO of Bank of America from Jewish Community Federation on Vimeo
Pete has retired, but Dick - who once ran Bank of America, and when he did, said that the assets of the bank walk out the door and go home every night - will still tell you how to live a balanced life.

Monday, October 31, 2011

Wells, Chase, Others Back Down on Debit Card Fees

Hey baby, there ain't no easy way out.

Wells Fargo announced on Friday that the 5 state test of debit card fees started on October 14 will be canceled.  TD Bank, the Canadian bank that acquired Commerce Bank last year, followed suit.

And, word is leaking out of Chase, accoding to the AP, that they will stop charging their $3-per-month fees when the current Wisconsin and Georgia pilots end next month.

Bank of America had news on Friday, too.  As with Chase, an unidentified source told the AP that B of A will offer ways for its customers to avoid debit card fees through using direct deposit, maintaining minimum balances and/or using their Bank of America credit cards.

Citibank, where debit card fees are already implicitly reflected in fees as high as $20 a month for the underlying checking account, is going to town talking about their never did, never will policy towards debit card fees.

Countering that, at least one credit union - Bethpage FCU in New York - is offering Free Checking for Life for new members of the Credit Union.  With commercial banks (like Chase) offering bounties of $100 or more to acquire a new customer, that might be pretty sharp marketing - communicating peace of mind and value, and spreading the bounty out over a longer period of time.

One thing is for sure.


The Waiting is the hardest part.  Tom Petty and the Heartbreakers, THANK YOU for supporting KCSN and playing our beautiful little Plaza del Sol theater at Cal State Northridge on Saturday night.  We will never forget you.

Wednesday, October 19, 2011

Relative Strengths of Banks v. Credit Unions

Copyright California CU League, graphic Joe Lackow 2011
In the past couple of weeks, we've seen a lot of anti-bank sentiment in response to the announcement of debit card fees, in the wake of reduced interchange income for the banks.  It has been salt in the wound of a huge bailout and  the role of banks in the foreclosure crisis, followed directly by bonuses and record profit.

This has extended to at least one representative in Congress who stood before us and told Americans to dump Bank of America to send a message about the $5 debit card fee.  I don't know about you, but as much as we may find banks culpable, I don't think that is very fair, nor is it the place of government to do.

As if consumers needed to be told, anyway.  They know how to vote with their feet really, really well.

And the Nightly Business Report video in the upper right of this page is but one example in a torrent of media coverage about Americans leaving B of A and other big banks in droves, and heading to their latest credit union.  In fact, one of our major CU clients hung signs in their branches with a big $5, in a big red circle, with a big red slash through it.  Other reports, from credit union leagues to the bar on the corner, are that there is a significant uptick in CU membership happening right now.

But whether you are a bank or a credit union or a consumer, there is something solid to be sold and to be bought, and tradeoffs to be made.  As the NBR report suggests, those who value convenience and security and the latest technology might do well to stay put with their big bank, because they do those things well and provide value for those fees.  And those who are value-oriented, prefer a bit more old-fashioned service, and care about credit union values like co-ownership would do well to investigate their credit union options.

Regardless, it's time to face facts, America.  It costs quite a bit for a bank or credit union to do all it needs to do to provide you with a good, solid, safe checking account, and there is quite a bit of value there - despite the fact that this has been given away by so many and for so long.  As always, it is a matter of understanding what one's customers and members want and demand; how one's competitors react and what they offer and charge; and the overall environment in which services are offered and consumed.

And most of all, every financial institution and every American should understand that BANKS DON'T MAKE MONEY OFF A SINGLE SERVICE CHECKING RELATIONSHIP, AND NEVER REALLY COULD.  It is the broader customer relationship that is profitable, to all concerned.  And to those who point to customers who generate a lot of NSFs and overdrafts, let me tell you something.  Relying on the kind of marginal customer who generates enough of these fees to seem profitable in the short and medium term will jump up and bite you on the ass one day - when they go belly-up on you.

Almost everyone's financial needs extend well beyond a checking account, and it is crucial to seek out relationship, whether based on transactions, consumer credit, home oriented lending, saving, investing, insurance and most likely, a combination of these that is market segment-specific.  Banks and credit unions will be most successful as they become more consultative, and move towards fee-based offerings like financial planning, retirement planning, college savings and planning, and medical savings and planning.  Rather than trying to make money on a sure loser, and one that has never really been logically charged for before.

You know where I'm going with this.  Where we always go.  To the GIS, where all of this data is integrated in one place to support informed product, service and fee decisions.