Wednesday, November 10, 2010

Can Brand Perceptions Impact Store Attractiveness?

The answer is, perceptions of customer service and value of the overall brand may absolutely impact store attractiveness - in fact, GIS analysis suggests they can make all the difference.

Here's a little market in Minnesota, but it could be your neighborhood.  There are four banking competitors and six branches here in the space of about 1/2 a mile - US Bank with two branches to the north, TCF Bank with two to the southeast, and Wells Fargo and M&I with one branch each towards the west.  Using customer perceptions of Overall Satisfaction, Reasonable Fees and Easy to Resolve Problems from the most recent JD Power Retail Banking Study for this region, we assigned the JD Power scores for each bank to each of its branches.  Then, we ran a very basic Huff model based on these perceptions, at left. 

The analysis shows that M&I will be able to successfully compete in this market with a much smaller office, and just one office, because the perceived service quality and value are attractive enough to have influence throughout the entire southern portion of the area.  To the north, US Bank benefits from having two offices with better perceptions than either Wells or TCF, and dominates the entire northern area. 

Based on deposits, which with date opened and several other factors is usually considered a key factor of attractiveness, we would expect something entirely different, depicted to the right in a model based purely on deposit size.  M&I is overwhelmed in this analysis, by the large Wells branch, the two TCFs including one large office, and the two US Bank locations.

Looking at the same neighborhood by equal competition or Thiessen analysis, where equidistant lines are drawn between each branch and its adjacent branches, this tends to flatter the institutions with multiple branches (left).


Simple rings tend to flatter the multibranch US Bank and TCF even more, as they dominate the market to the north and south, respectively.


Meanwhile, drivetime polygons tend to depict a lot of overlap, given the immediate proximity of all the offices to a single, main intersection.


Hardly definitive, but food for thought.  To what extent can perceptions of good customer service and value overcome weaker convenience and ease of access, and how do we model it in GIS?  By the way, that is RPM's MarketBank potential for deposits as the underlying theme, the greener the better.

Monday, November 1, 2010

Blind To Site, Part III


Back in the day... Site work used to be so much... work.

Trudging around, filling out a site questionnaire longhand that would only need to be transferred to a computer later. Then, brought step by step into a spreadsheet, a database.

Then finally into desktop GIS, ultimately to be integrated with the existing network.

Fumbling for a camera to take photos. Mumbling voice notes into a hand-held voice recorder.  Scrambling on the cellphone to relay results.  Worst of all, dropping the notebook PC you brought out with you, ostensibly to save a little time.

No more.  Now we do it all on the Samsung Ultra Mobile PC.  On one tablet device, I can do it all - photos, voice, full Excel spreadsheet, even ArcGIS.

Suddenly, what used to take forever and was no fun at all is now made quick, easy, fast.  Work has become a pleasure again.  I can collect all the rich data I need in every way I need literally in the palm of my hand.

And integrate my field work with the network in real time.

Not to mention that tablet computing is a blast, and definitely the next Big Thing (witness the IPad).  
However - unlike the IPad, this Samsung has an integrated QWERTY keyboard - and more importantly, a full blown OS (Windows XP SP3), a powerful mobile CPU, and fully 2GB of RAM.  And if you are not quite as literate texting as your kids are, you can write longhand right onto the PC using a stylus and an input area, and the handwriting recognition kicks in.

What a joy it is to gather the info digitally, once,
into an Excel spreadsheet...
then pull that into ArcGIS...
integrate it with the existing network...
analyze the impact on that network...
compare it with other site options... and
distribute the information throughout the organization and to partners before I even get back into the car to drive to the next site.


We've been using these Samsung UMPCs for over three years now, and we love them.  More so, we're in love with tablet computing.  

So much so, we just bought one of Samsung's new 40 inch touchscreens.

Now, I just have to find a way to mount it into my vehicle.

Thursday, October 28, 2010

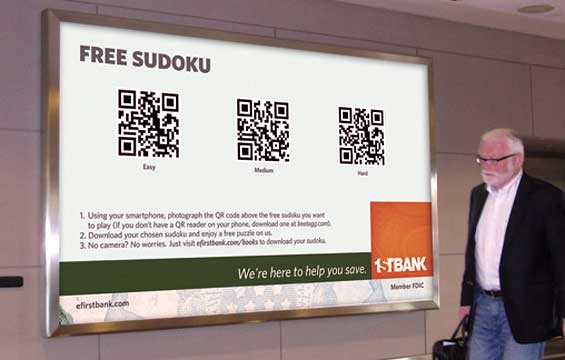
1stBank Deploys QR Code Advertising

It's a link.  It's a bar code.  It's Pop Art.  It's a QR code!  And it's another mobile technology that caught fire in Japan years ago and is still finding its way to the States.

On the one hand, this is a very promising mobile technology, on the other, just another way to pass a link.  Content is king, as always.  If the website or other content you are whisked off to is useful, valuable, and/or entertaining, then you have something.  If your site is lame, and/or you are lame in referring customers to it and then dropping the ball, you will remain lame (just a more geeky lame).

1stBank in Colorado is one of the first movers on QR codes, providing reading material and puzzles for a virtual waiting room in the Denver International Airport.  QR code posters inside the airport (photos courtesy of The Financial Brand) are headlined “Free Books,” “Free Crosswords,” and “Free Sudoku” and link to a selection of classic novels, crosswords and Sudoku.

Microsoft has its own, color version of QR codes, aimed particularly at mobile tagging applications, called Microsoft Tag.

You can create QR codes to your own content at sites like this- the technology is free of any license, easy to use, and offers some very interesting opportunities.

Here's a QR code to RPM's The GIS Biz, which covers general business and location intelligence news.

Monday, October 25, 2010

Savings and Investment Potential by Political Party Preference: An Analysis of Political Contributors

Occasionally, as we dig through the various databases we use in our practice, we discover datasets that have to potential to answer interesting questions that we sometimes wonder about. This past summer, we happened across the database of political contributions by zip code through July 28, 2010, made available at CampaignMoney.com, which provides access to all political contributions recorded by the Federal Elections Commission.  We thought it would be interesting to see whether zip codes differ with respect to socioeconomic status as measured by savings and investment potential, based upon which party received the majority of contributions. 
Our methodology was rather straight-forward. We began by categorizing each zip code in California, based on whether the largest percentage of contributions was made to Democrats, Republicans, or “Other. We then calculated the average MarketBankTM deposit potential and investment potential per resident household and then tested the means for statistical significance using an Analysis of Variance (ANOVA) procedure.  As a second method of evaluating differences, we also categorized zip codes in which all of the contributions went entirely to a single party (or other), versus those in which contributions were spread between two or more parties.
Findings
Overall, CampaignMoney.com provided data for 26,791 zip codes in which political contributions were made, of which 21,683 were able to be matched to the MarketBankTM database.  Within the zip codes matched to MarketBankTM, a total of $916,895,087 was contributed, broken out as follows:

Party
Total Contributions
Zip Codes Contributing Predominantly to One Party
Zip Codes Who Contributed Entirely to One Party
Republicans
$139,787,007
2,307
809
Democrats
$369,233,991
3,674
1,227
Other
$407,874,089
7,791
3,405
No contributions
7,911
16,242


MarketBankTM deposit potential estimates were calculated for each zip code on a “per household” basis, providing the average bank checking and savings deposits likely to be held in U.S. financial institutions. Based on the classifications of zip codes by contributions by political party, the average deposit potential and investment potential per household for zip codes were averaged for zip codes who predominantly contributed to Republicans, Democrats, and others (as well as those from which no contributions were recorded to any party.
The key question we wanted to answer was whether there is a significant difference between contributors to Democrats and contributors to Republicans on the basis of the socioeconomic status of the contributor’s zip code. Using the MarketBankTM bank deposit potential per household and investment potential per household as two proxies for socioeconomic status, we discovered that there is a statistically significant difference (p<.001) between zip codes in which residents primarily contribute to Republicans versus those who primarily contribute to Democrats.  The average deposit potential per households of predominantly Republican-contributing zip codes was $19,021, compared to $20,465 for Democrat-contributing zip codes, and $19,763 for zip codes that contributed predominantly to other parties.
Investment potential per household followed a similar pattern, with Republican zip codes being lowest and Democrat zip codes highest in terms of potential.

Party
Zip Codes Contributing Predominantly to One Party
Bank Savings Deposit Potential per Household
Investment Potential per Household
Republicans
2,307
$19,021
$227,451
Democrats
3,674
$20,465
$257,226
Other
7,791
$19,762
$242,168
No contributions
7,911
$17,552
$199,998


With respect to zip codes in which all contributions were made entirely to a single party, a similar statistically significant pattern (p<.001) can be observed , with the average deposit potential of $18,003 for Republican zip codes falling somewhat lower than the $18,542 for Democrat zip codes, and $18,621 for zip codes where all of the contributions were intended for a party other than Democrat or Republican.

Party
Zip Codes Contributing Entirely to One Party
Bank Deposit Potential per Household
Investment Potential per Household
Republicans
809
$18,003
$208,191
Democrats
1,227
$18,542
$220,746
Other
3,405
$18,621
$218,923
No contributions
16,242
$19,958
$261,128


Although, the difference is not overwhelming, one can conclude from these data that communities (as defined by zip codes) in which political contributors lean Republican may tend toward less wealth in comparison to communities in which contributors lean Democrat, or toward other political parties. Although this does not represent an exhaustive study of socioeconomic status associated with party preference, it provides an interesting starting point for further analysis.  In particular, a further breakdown of the “other” contributors may provide some insight as to where those funds are ultimately directed, and how those contributors may differ demographically.

Thursday, October 21, 2010

Here's To You, Mr. Robinson (and Kristen and Raj T)

If you use Esri Business Analyst, know it or not, chances are you've been assisted at one time another by the technical support angels - Kristen Carroll, Jason Robinson and Raj T(huthija).  They are there to help you, and they help us help you immensely.  From time to time, we will share some of this with you.  Please realize however that any comments you see here are not representative of Esri, just informal stuff of interest.

One of the things we love talking with Jason about is what PC hardware is best for GIS.  After all, having the right system in the first place sure makes support easier.


Recently, we posted on the RPM blog about using the Ready Boost feature on Vista and Windows 7 to allow an older PC to run ArcGIS 10.  But, truth be known, RPM has purchased new PCs for Business Analyst 10.  And here is what we bought - the Asus K50AF.  Even though Esri recommends Intel CPUs, we have had very good results with AMD processors, and this is a highly rated machine.  It has 4GB of RAM and another 1/2 GB of video RAM. This PC is going for around $700 on Amazon right now. 
 
You may opt for a slightly different model to take advantage of using 8GB of RAM on this 64 bit PC - and indeed, the amount of RAM is key.  ArcGIS can really use the extra RAM, and you need a 64 bit machine to do it - as 32 bit operating systems cannot use more than 4GB of RAM whether they are XP SP3 or Vista or W7.  The bottom line is, you want a gaming computer.  The same kind of PC that is great for video games is great for CAD and GIS.

This Asus is now the basic PC that RPM delivers to clients pre-installed with their banking base map and application.  (Many of our clients get the PC free with their BA subscription, and you can ask us about that).

What is REALLY interesting to those of us who love this stuff is the question of what kind of desktop computer is ideal for GIS.  This is where Jason has some interesting takes on the kind of PC he builds for himself, as a professional GIS practitioner and as an avid, experienced gamer.  And here's some of what he has to say. 

In my personal opinion the real keys as far as a great performing
computer:

1.  The best CPU that makes sense budget wise.  I prefer duo cores to
quads+ due to the higher clock cycle though I believe duo cores are
gradually getting phased out for quad and more cores.  Clock
cycle=horsepower but I can understand why going with quad core or more if
someone is doing a lot of multi tasking.

2.  64 bit operating system.  Window 7 64 bit makes the most sense.  BA
development has found dramatic performance increases with a 64bit OS and
8 gigs of RAM when running the OD cost matrix type functions (point to
point drive time/distance functions in Locator Report/Desire Lines).

3.  System memory of 8 gigs or more.

4.  Raid-0 or Raid-0+1 hard drive configuration.  Fantastic read/write
performance and noticeable system performance increase across the board.
I'm still a bit leery of the SSD drives considering the premium for the
latest generation models.  (Note: this is changing, and Solid State Drives are
indeed very fast).

5.  For video cards a middle of the road one is fine.  This mainly helps
with re-draw speeds but those will be somewhat constrained by ArcGIS. 
(Note: we love extra dedicated video RAM).


Banking GIS Users Unite

Everyone who uses GIS in banking, and/or would like to learn more about it, is welcome here - regardless of what software you use or don't use.  Anyone can comment.  And, you can post here, too and begin your own discussions.  If you would like to comment, fire away.  If you'd like to post, just send us an e-mail, tell us a little about what you do, and we'll invite you.

Savings & Investment Potential By Political Party Preference

Republican Fat Cats?  Not so much.  Check out RPM's general GIS Blog for a very interesting discussion on the relative saving and investing potential of Republican v Democrat campaign contributors.